Instantaneous oil plume structures in ocean Langmuir turbulence:
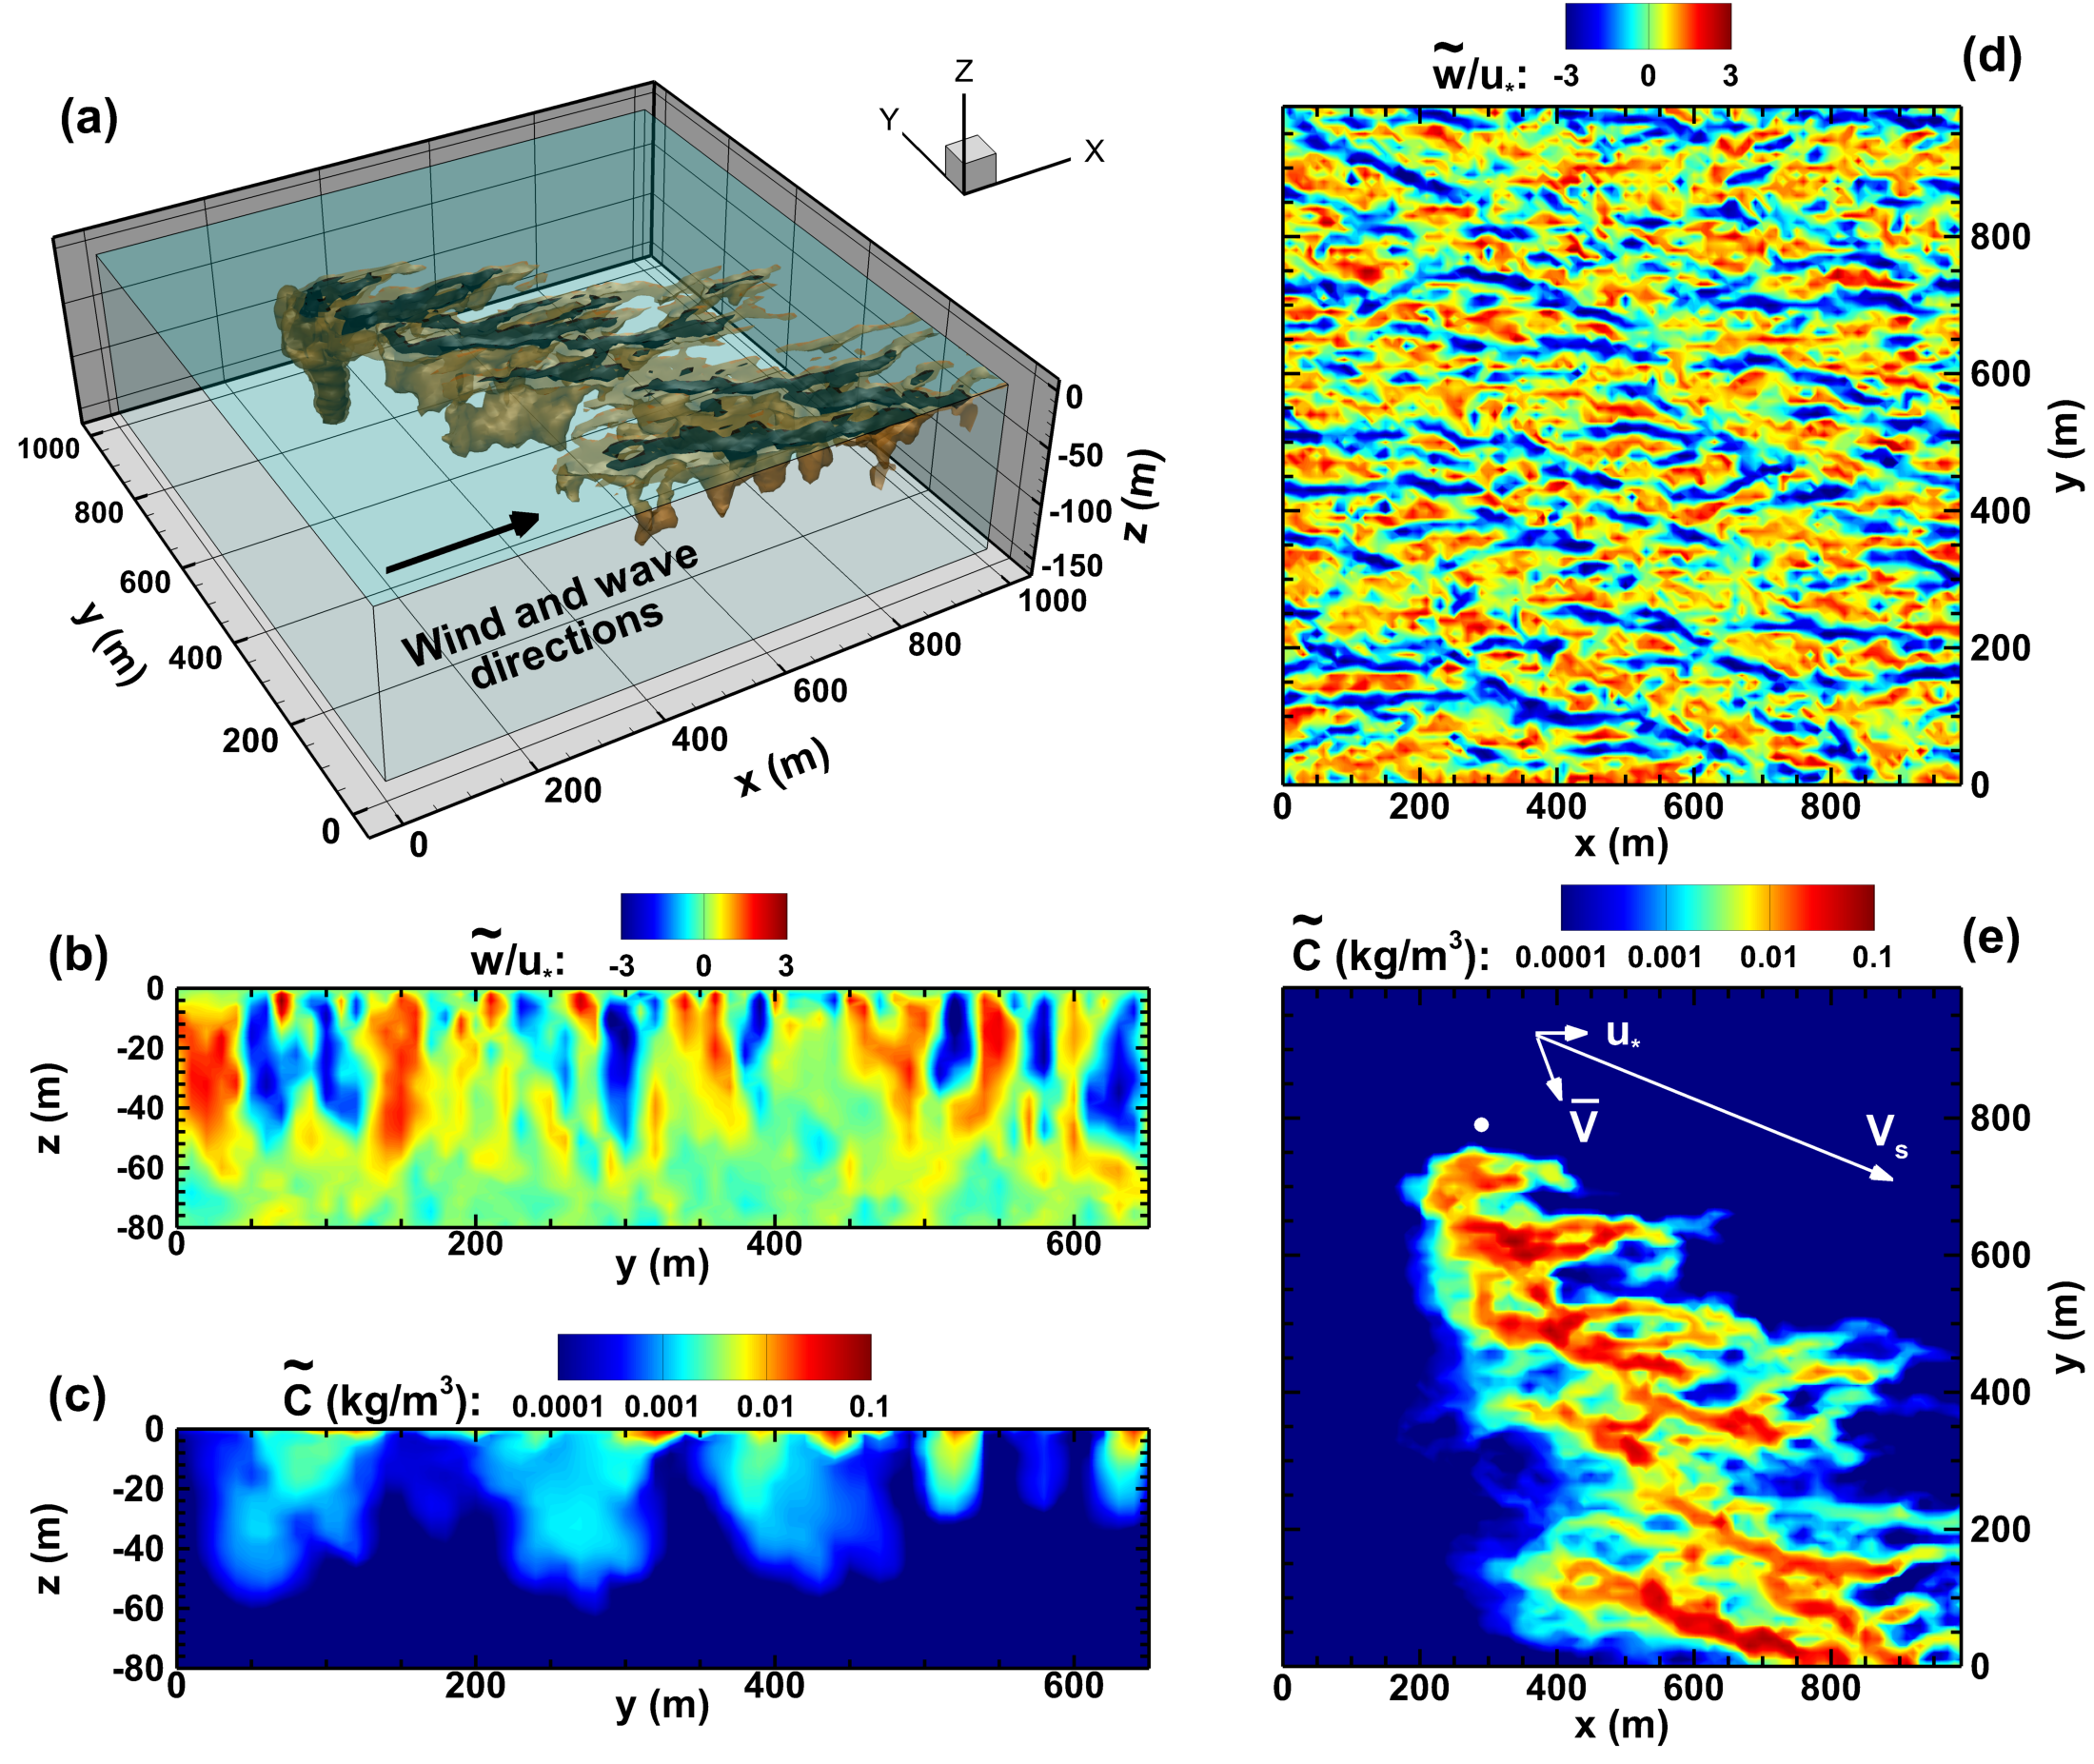
Overview of LES results modeling oil spill dispersion in the ocean mixed layer with the presence of Langmuir circulation. (a) Three-dimensional isosurfaces of oil concentration C=0.008 kg/m^3 (brown) and 0.016 kg/m^3 (black). (b) Contours of vertical velocity w at x=500m. (c) Contours of oil concentration C at x=500m. (d) Contours of vertical velocity w at z=−10m. (e) Contours of oil concentration C at z=0m. In panel (e), reference vectors for friction velocity u∗, mean surface flow velocity Vs, and mean depth-averaged (over OML) flow velocity V are plotted. More details of the large-eddy simulation model and the flow configuration can be found in Yang et al. (2014, Geophys. Res. Lett.) and Yang et al. (2015, J. Geophys. Res. Oceans).
Categorization of surface oil plume patterns:
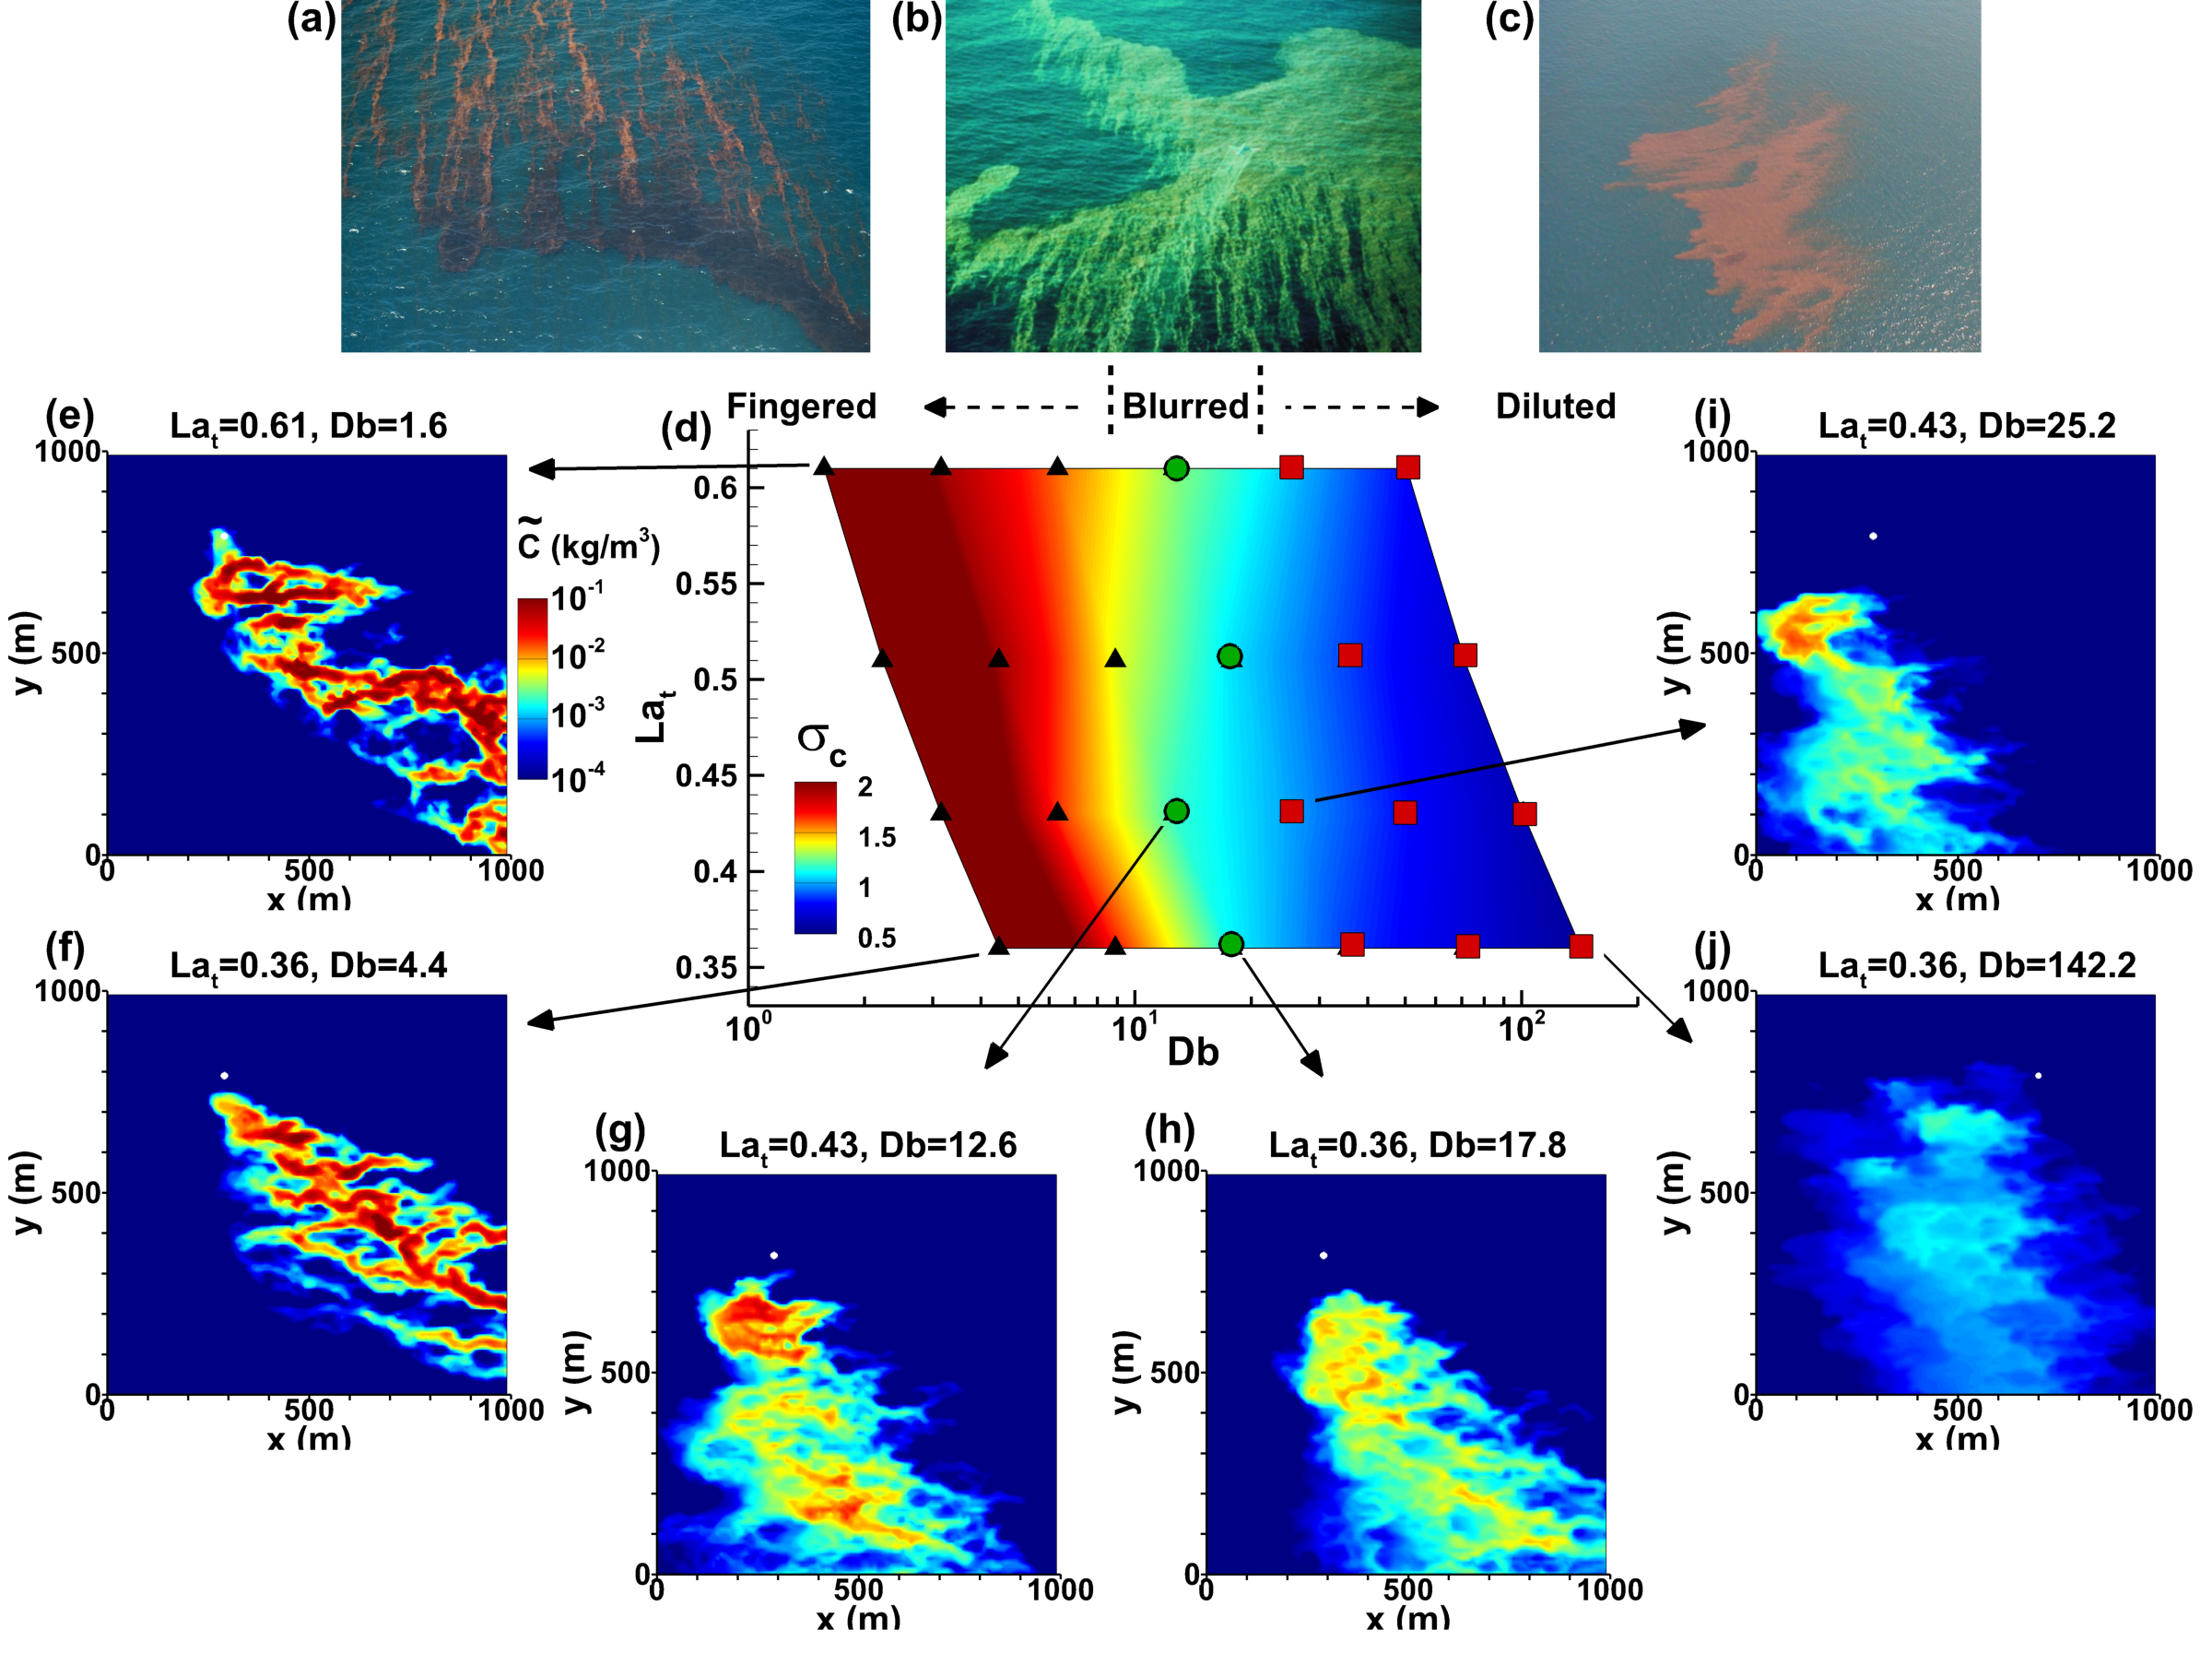
Dispersion regimes for surface oil slicks from underwater blowouts. (a–c) Field images of surface oil slicks. (d) Fingering level sigma_c as a function of drift-to-buoyancy ratio Db and turbulent Langmuir number Lat. (e–j) Contours of oil concentration C on the surface obtained from the LES, where the white dot indicates the horizontal location of the underwater releasing source. In panel 1(d), the surface oil slicks from the 24 LES cases are categorized into three regimes: black triangle, fingered (Db≲10); green circle, blurred (10≲Db≲25); and red square, diluted (Db ≳ 25). For panel 1(a), photo credited to U.S. Air Force photo/Tech. Sgt. Adrian Cadiz; for panel 1(b), photo credited to NOAA Hazardous Materials Response Division, now NOAA office of Response and Restoration; for panel 1(c), photo credited to National Wildlife Federation/NWF.org. More details of the results and analysis can be found in Yang et al. (2014, Geophys. Res. Lett.).